Chapter 01
A brief history of climate science
Timeline
Progress in climate sciences dates back 200 years.
Climate science is not a new field. By the time of the American Civil War, it was well-known that a handful of gases that make up less than 1% of the air absorb radiation from the sun and the earth, and emit some of it back to Earth. We now know that without those gases, the average surface temperature of the planet would be well below freezing, and human life would not exist. How did these early scientists study this? What else affects our Earth’s climate, and what does it have to do with recent warming?

Learn More
Chapter 02
The greenhouse effect and us
02a How it works
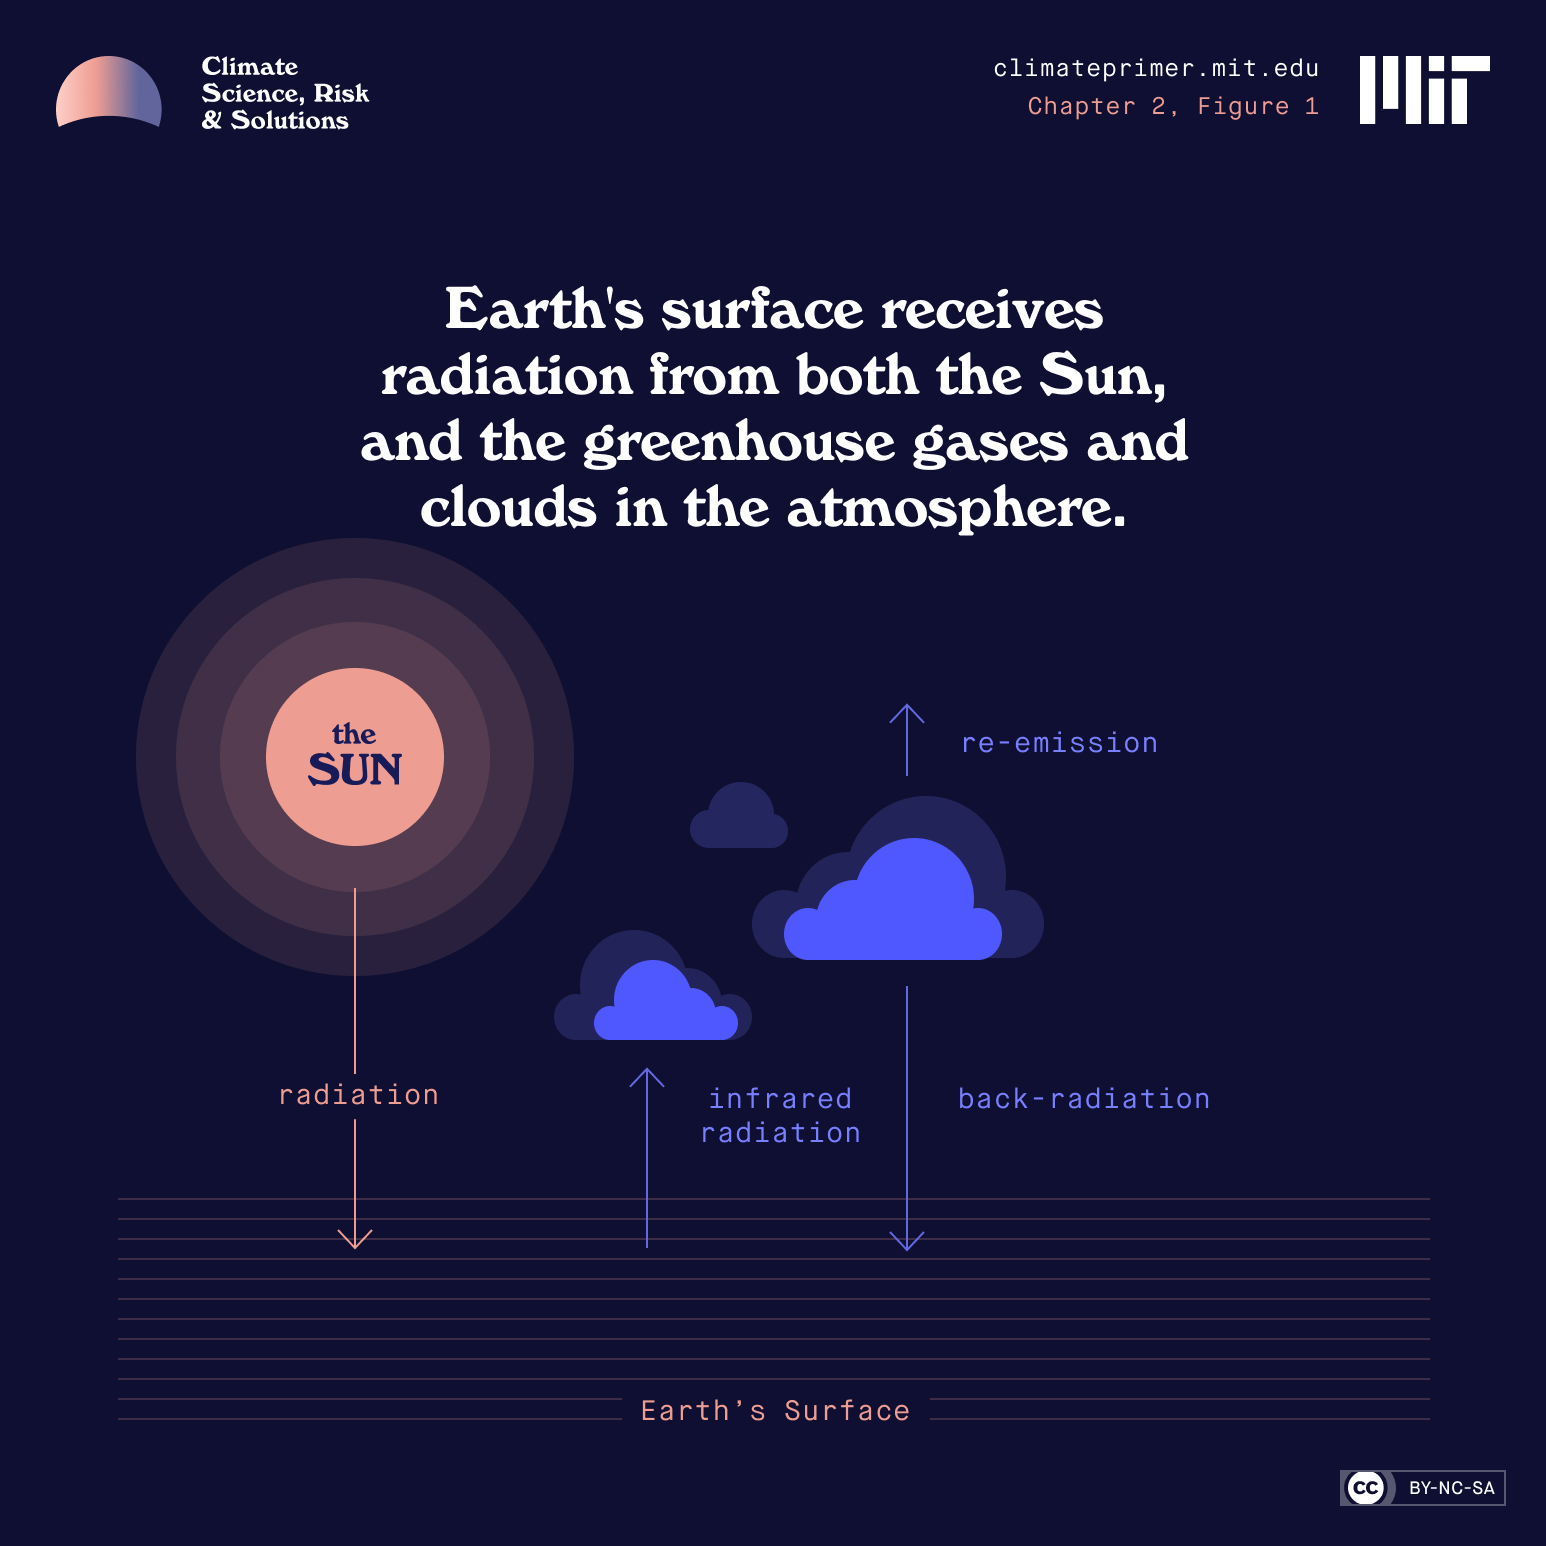
Why does the absorption and emission of infrared radiation by the atmosphere warm the planet? When the greenhouse gases (and clouds, which also act as greenhouse agents) absorb infrared radiation, they must re-emit radiation, otherwise the temperature of the atmosphere would increase indefinitely. This re-emission occurs in all directions, so that half the radiation is emitted broadly downward and half broadly upward. The downward part (“back-radiation”) is absorbed by the earth’s surface or lower portions of the atmosphere. Thus, in effect, Earth’s surface receives radiant energy from two sources: the Sun, and the back-radiation from the greenhouse gases and clouds in the atmosphere, as illustrated in Figure 1.
Earth’s surface receives almost twice as much radiation from the atmosphere as it does directly from the Sun.
This is partly because the atmosphere radiates 24/7, while the Sun shines only part of the time.
The warmer a surface, the more radiation it emits. Earth’s surface must get warm enough to lose enough heat to balance both sunlight and back-radiation from the atmosphere and clouds. That is the greenhouse effect. It should be remarked here that none of the preceding is remotely controversial among scientists, not even those few who express skepticism about global warming.
02b Our Atmosphere
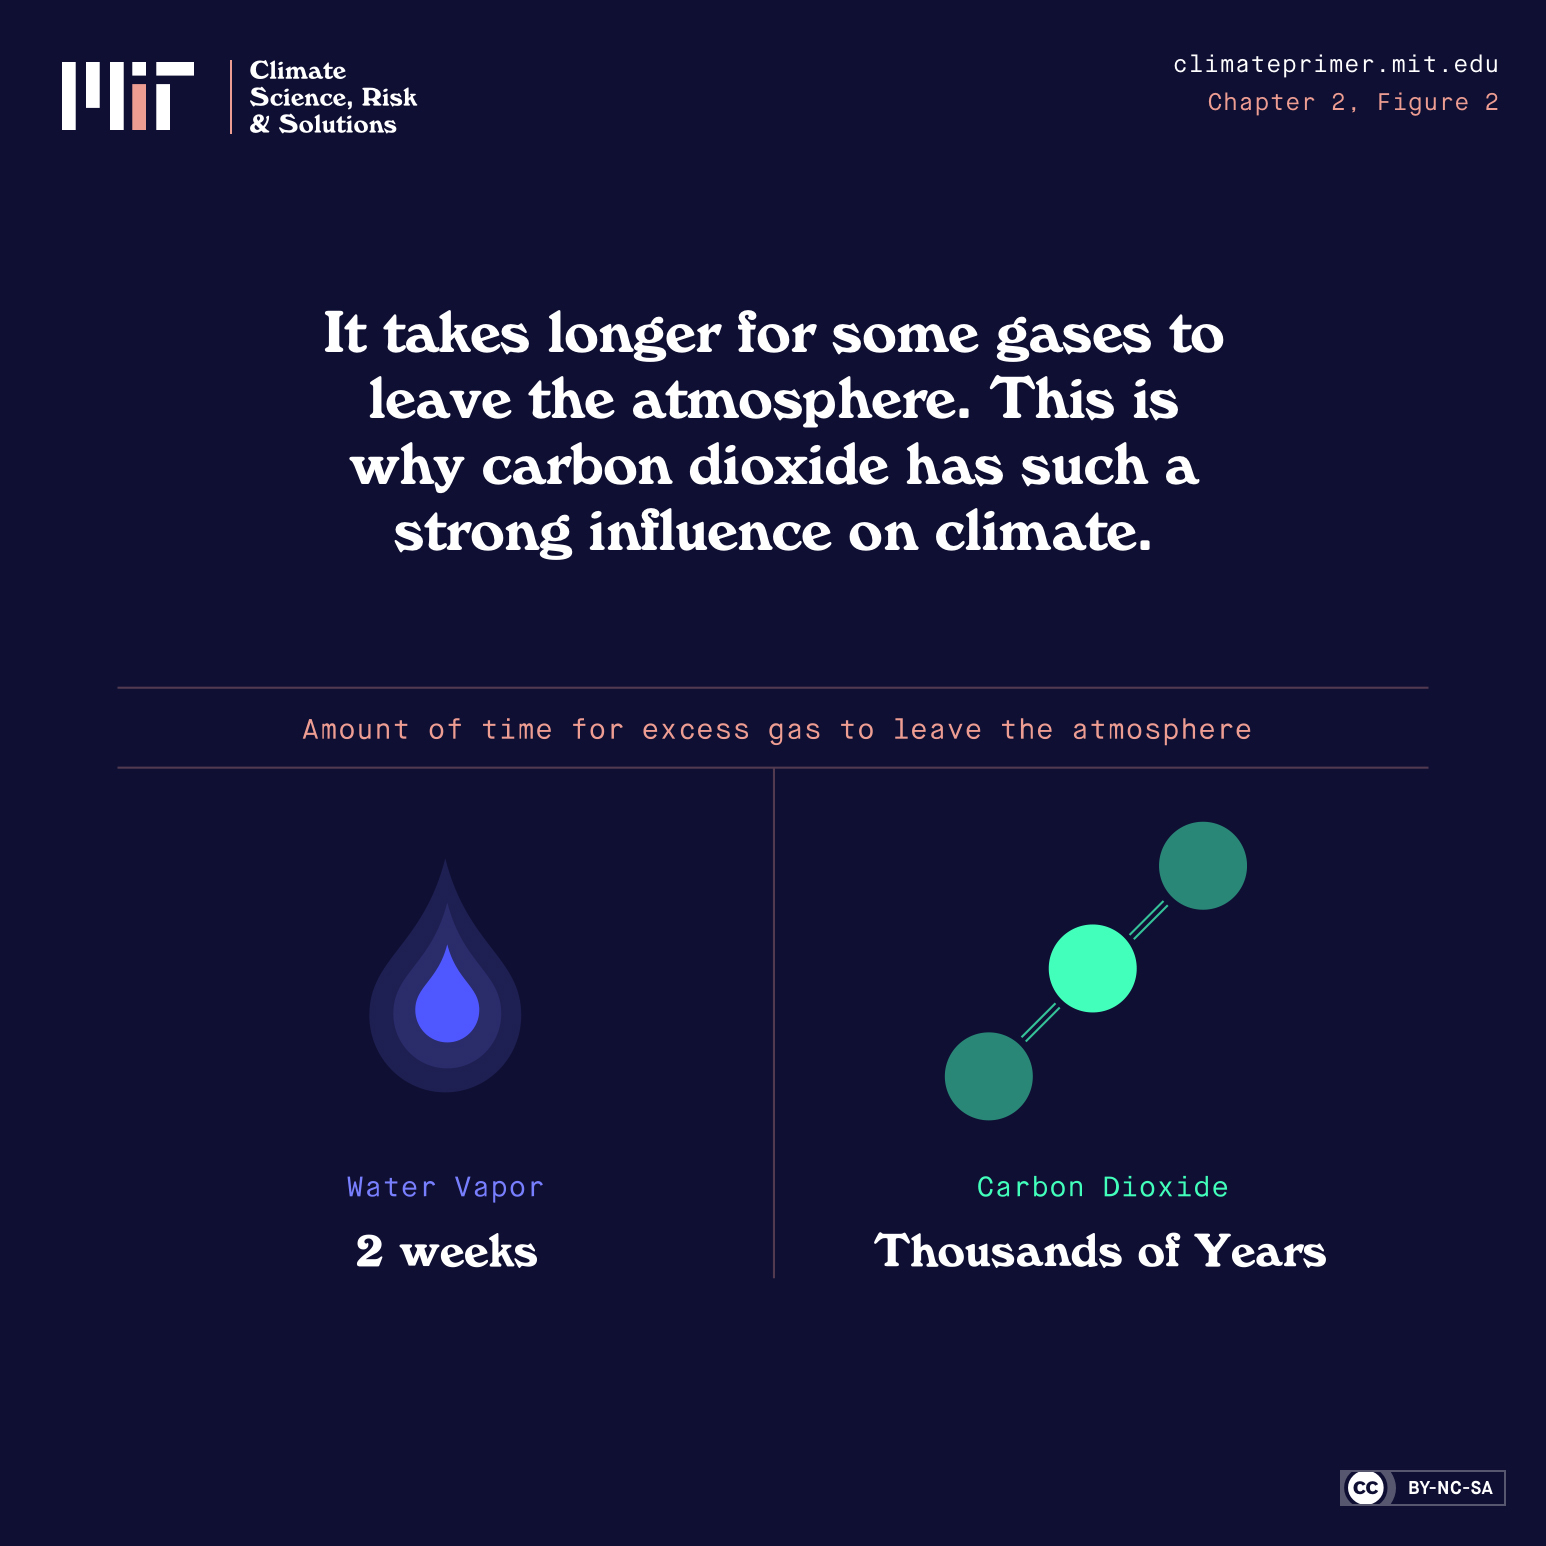
At the opposite extreme in terms of atmospheric lifetime is carbon dioxide. It is naturally emitted by volcanoes, outgassing from oceans, decomposing biomass, wildfires, and some animals. It is absorbed by biological and physical processes that eventually incorporate the carbon into carbonate rocks like limestone. On geologic time scales, these carbonate rocks are pushed down into the earth’s mantle at The places in the earth’s mantle where one tectonic plate slides beneath anotherconvergent boundaries, and the carbon is eventually released back into the atmosphere as carbon dioxide through volcanoes or when the rock is once again exposed to air and weathered. This cycle takes many tens to hundreds of millions of years. But CO2 also cycles through the atmosphere, ocean, and land plants on a different time scale, on the order of hundreds—not millions—of years.
Water vapor and carbon dioxide (CO2) both contribute to the greenhouse effect, but CO2 has an important influence on climate change because CO2 stays in the atmosphere for a long time. If we were to magically double the amount of water vapor in the atmosphere, in roughly two weeks the excess water would rain and snow back into oceans, ice sheets, rivers, lakes, and groundwater. Because water vapor leaves the atmosphere so quickly, the pulse of vapor doesn’t have much of a long-term warming effect. But if we were to instantly increase the concentration of CO2, it would take roughly 100 years for about half of it to cycle back into plants and the ocean. The other half? Thousands of years. This is why long-lived greenhouse gases like carbon dioxide have an important influence on Earth’s climate.
02c The impact of increased CO2
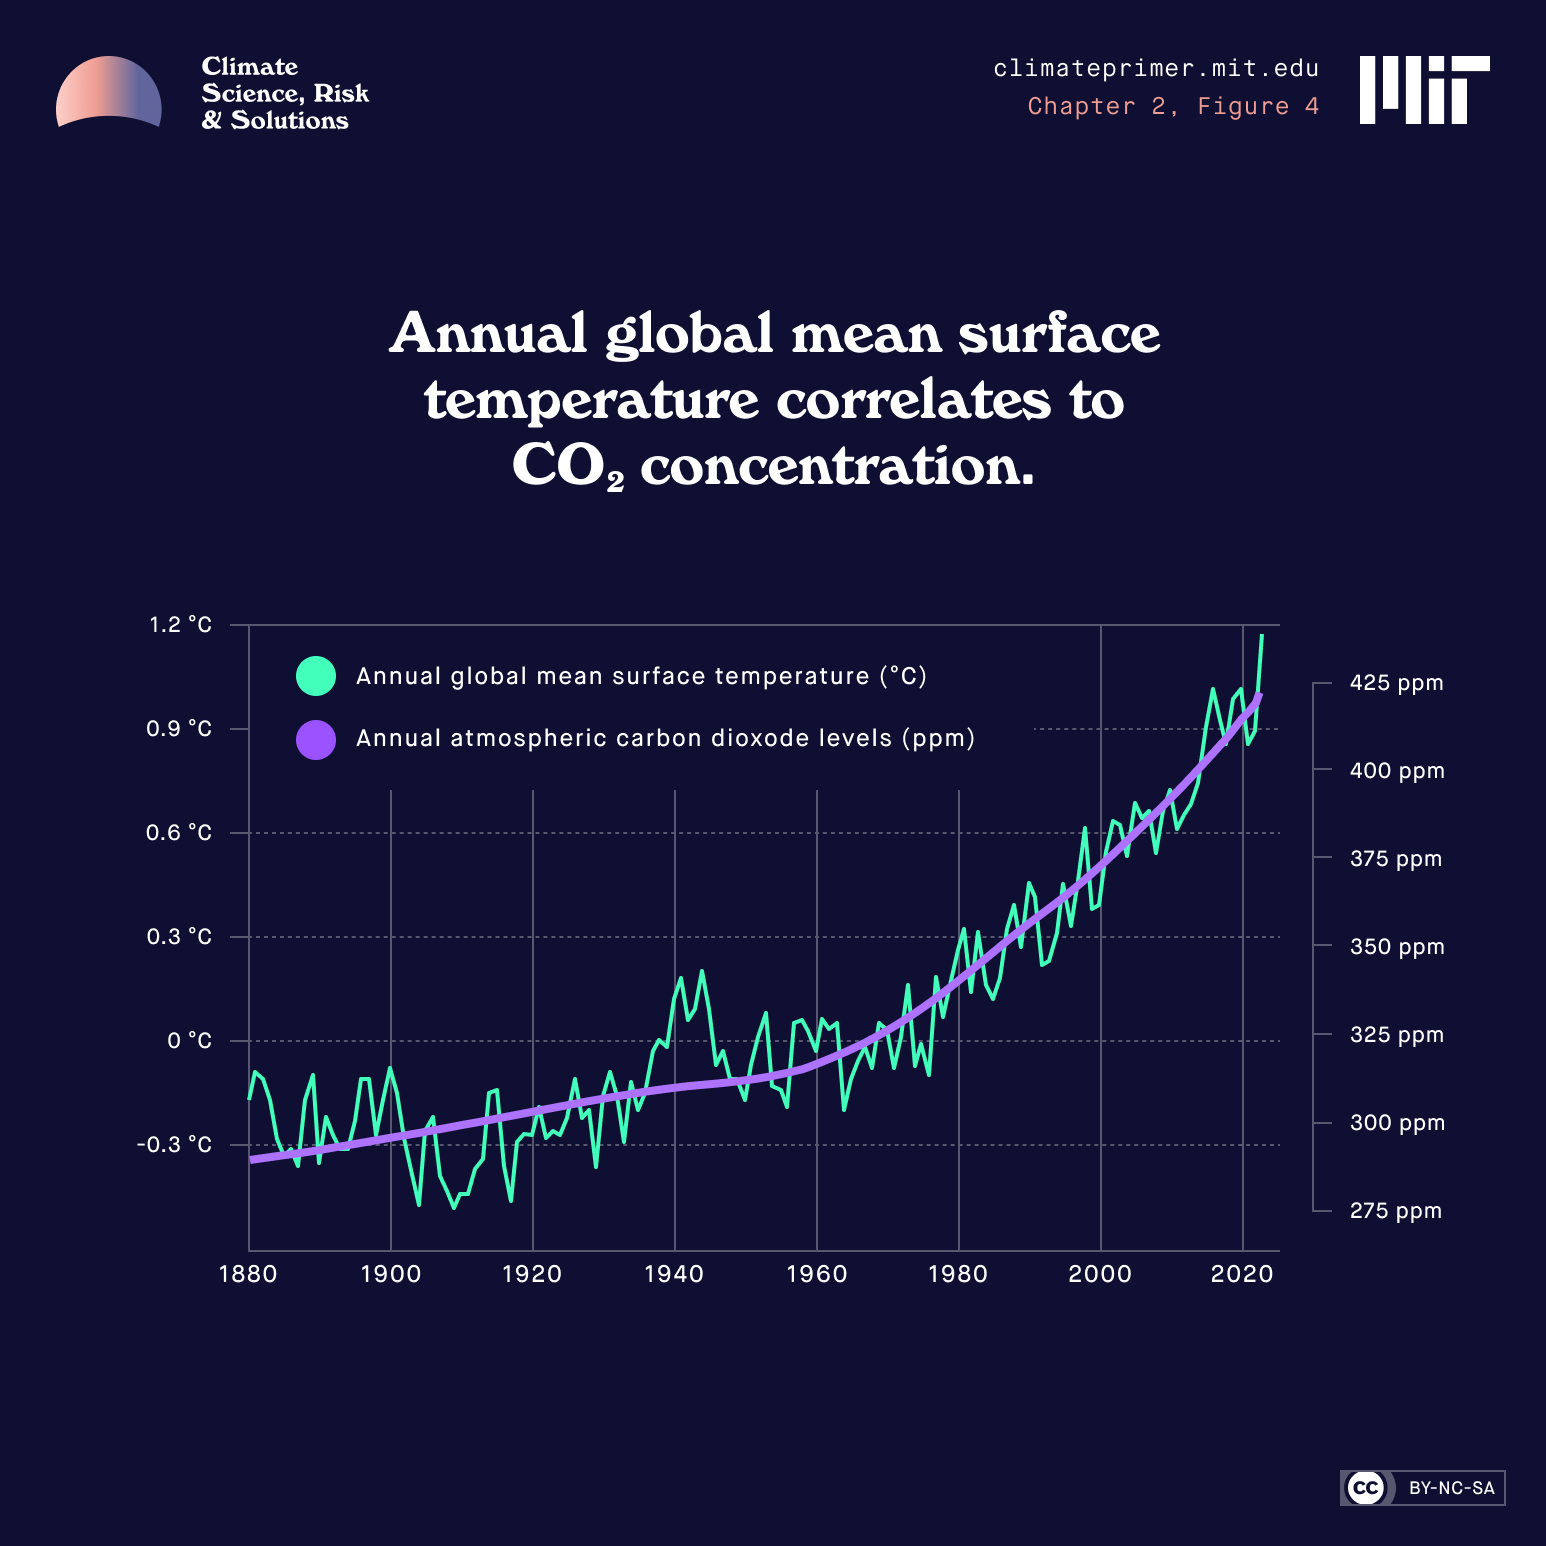
Climate is always changing, so what is so special about the last 100 years?
But what if we are fooling ourselves? Correlation is not causation, and perhaps the correspondence of temperature and CO2 is a coincidence—maybe something else is causing the warming. Or perhaps the rising temperature is causing CO2 concentrations to increase and not the other way around. How accurate is the curve in Figure 4—can we really measure the global mean temperature? Climate is always changing, so what is so special about the last 100 years? Are there other predictions of climate science that are verified or contradicted by observations?
These are all legitimate questions and deserve serious consideration; indeed, we would not be good scientists if we did not constantly ask ourselves such questions.
03a Historic temperatures
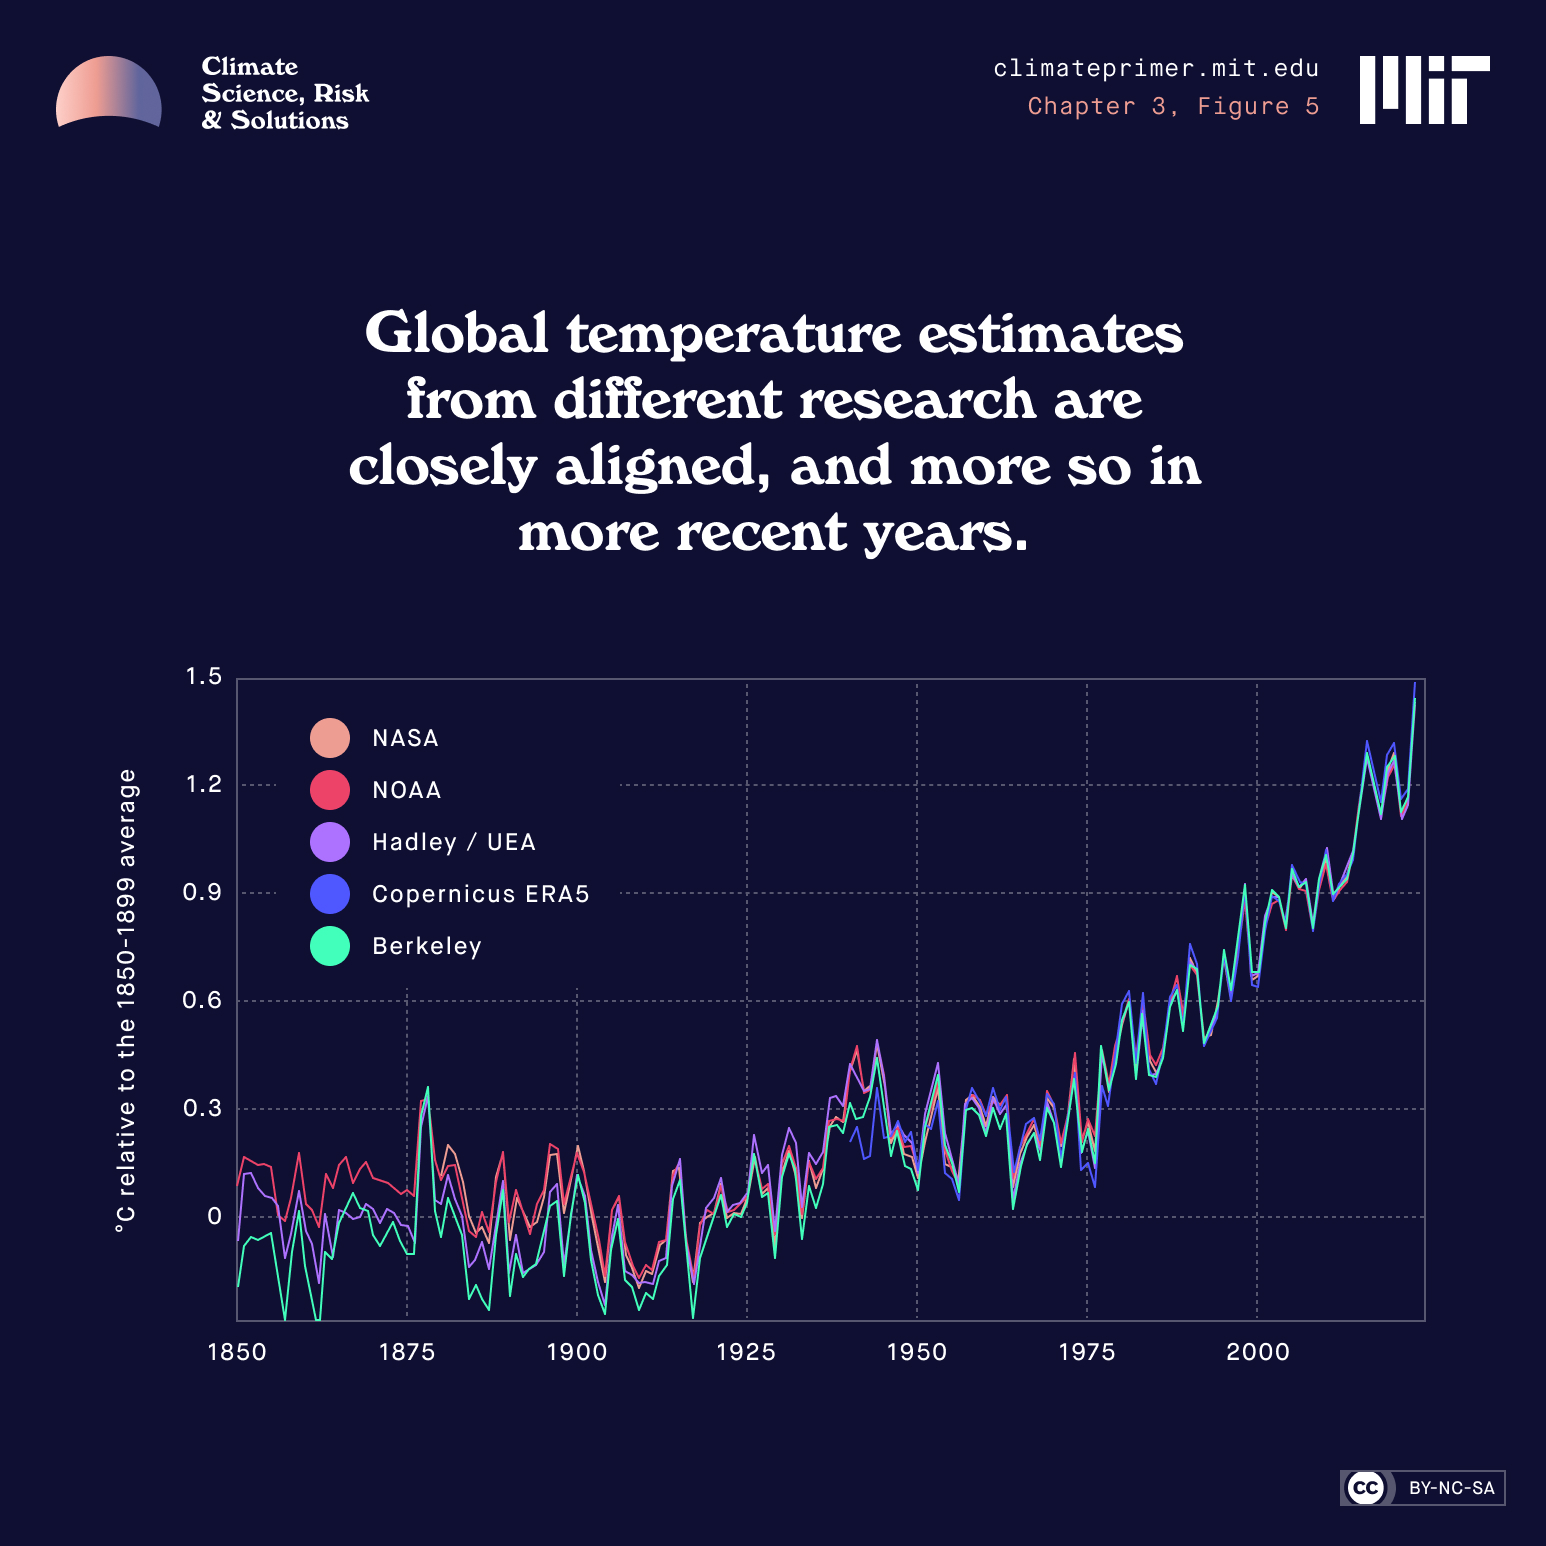
Let’s begin with the instrumental record of global average surface temperature. Thermometers were invented in the 17th century, but it was not until the 19th century that people started to make systematic, quantitative measurements around the globe. Naturally, most of these were made from land-based stations, but it was not long before measurements were being taken from ships, including measurements of the temperature of ocean water at and near the surface. (Benjamin Franklin discovered the Gulf Stream by lowering a thermometer into the ocean from a ship.) Sea surface temperature was measured routinely from buckets of water retrieved from the sea, and then, beginning in the 1960s, by taking the temperature of engine intake water. By the late 1960s, these measurements were being augmented by satellite-based measurements of infrared radiation emitted from the sea surface.
In estimating global mean temperature, one must carefully account for the uneven distribution of temperature measurements around the world, changes in the precise location and instruments used to measure temperature, the effects of growing urban areas that create heat islands that are warmer than the surrounding countryside, and myriad other issues that can bias global mean temperature. Different groups around the world have tackled these issues in different ways, and one way to assess the robustness of the temperature record is to compare their different results, as shown in Figure 5. Despite differences in their methodologies and assumptions, these independent records agree with each other quite well after about 1900 and especially well after about 1950. The better and better agreement reflects the increasing number and quality of temperature measurements around the planet.
Different scientific groups have tackled measurement issues in different ways, yet their results agree with each other quite well.
We are therefore very confident that these records are accurate.
Theory and models predict that the air over land and at high latitudes should warm faster than that over the oceans, and this is indeed what we observe when measuring air temperature over land and sea. Global warming is neither predicted nor observed to be globally uniform, which can be seen in Video 1, and there are even places where the temperature has dropped over the second half of the 20th century, thanks to changing Ocean circulation, or current, is a continuous, directed movement of sea water generated by a number of forces acting upon the water, some of which include wind, breaking waves, temperature, and salinity.ocean circulation, melting sea ice, and other processes. The spatial patterns of global warming also clearly reveal that this warming cannot be explained by the A phenomenon whereby cities experience higher air temperatures than the surrounding countryside, primarily as a result of the replacement of cooling features like water and vegetation with heat-retaining buildings and pavements.urban heat island effect. Some of the fastest warming is in places far removed from cities, like Siberia and northern Canada; in fact, at most 2%–4% of the earth’s total warming can be attributed to urbanization.
But how does that record of temperature and CO2 fit with the longer-term climate record? Is it unusual or is it consistent with natural climate variability on 100-year time scales? Since we do not have good global temperature measurements before the 19th century we must turn to the fascinating field of Ancient climates for which systematic measurements were not taken. Using proxies like ice sheets, tree rings, corals, shells, and microfossils, we can reconstruct ancient climate in order to understand natural variation in climate and the evolution of the current climate.paleoclimate, which seeks proxies for climate variables in the geologic record.
03b Prehistoric records
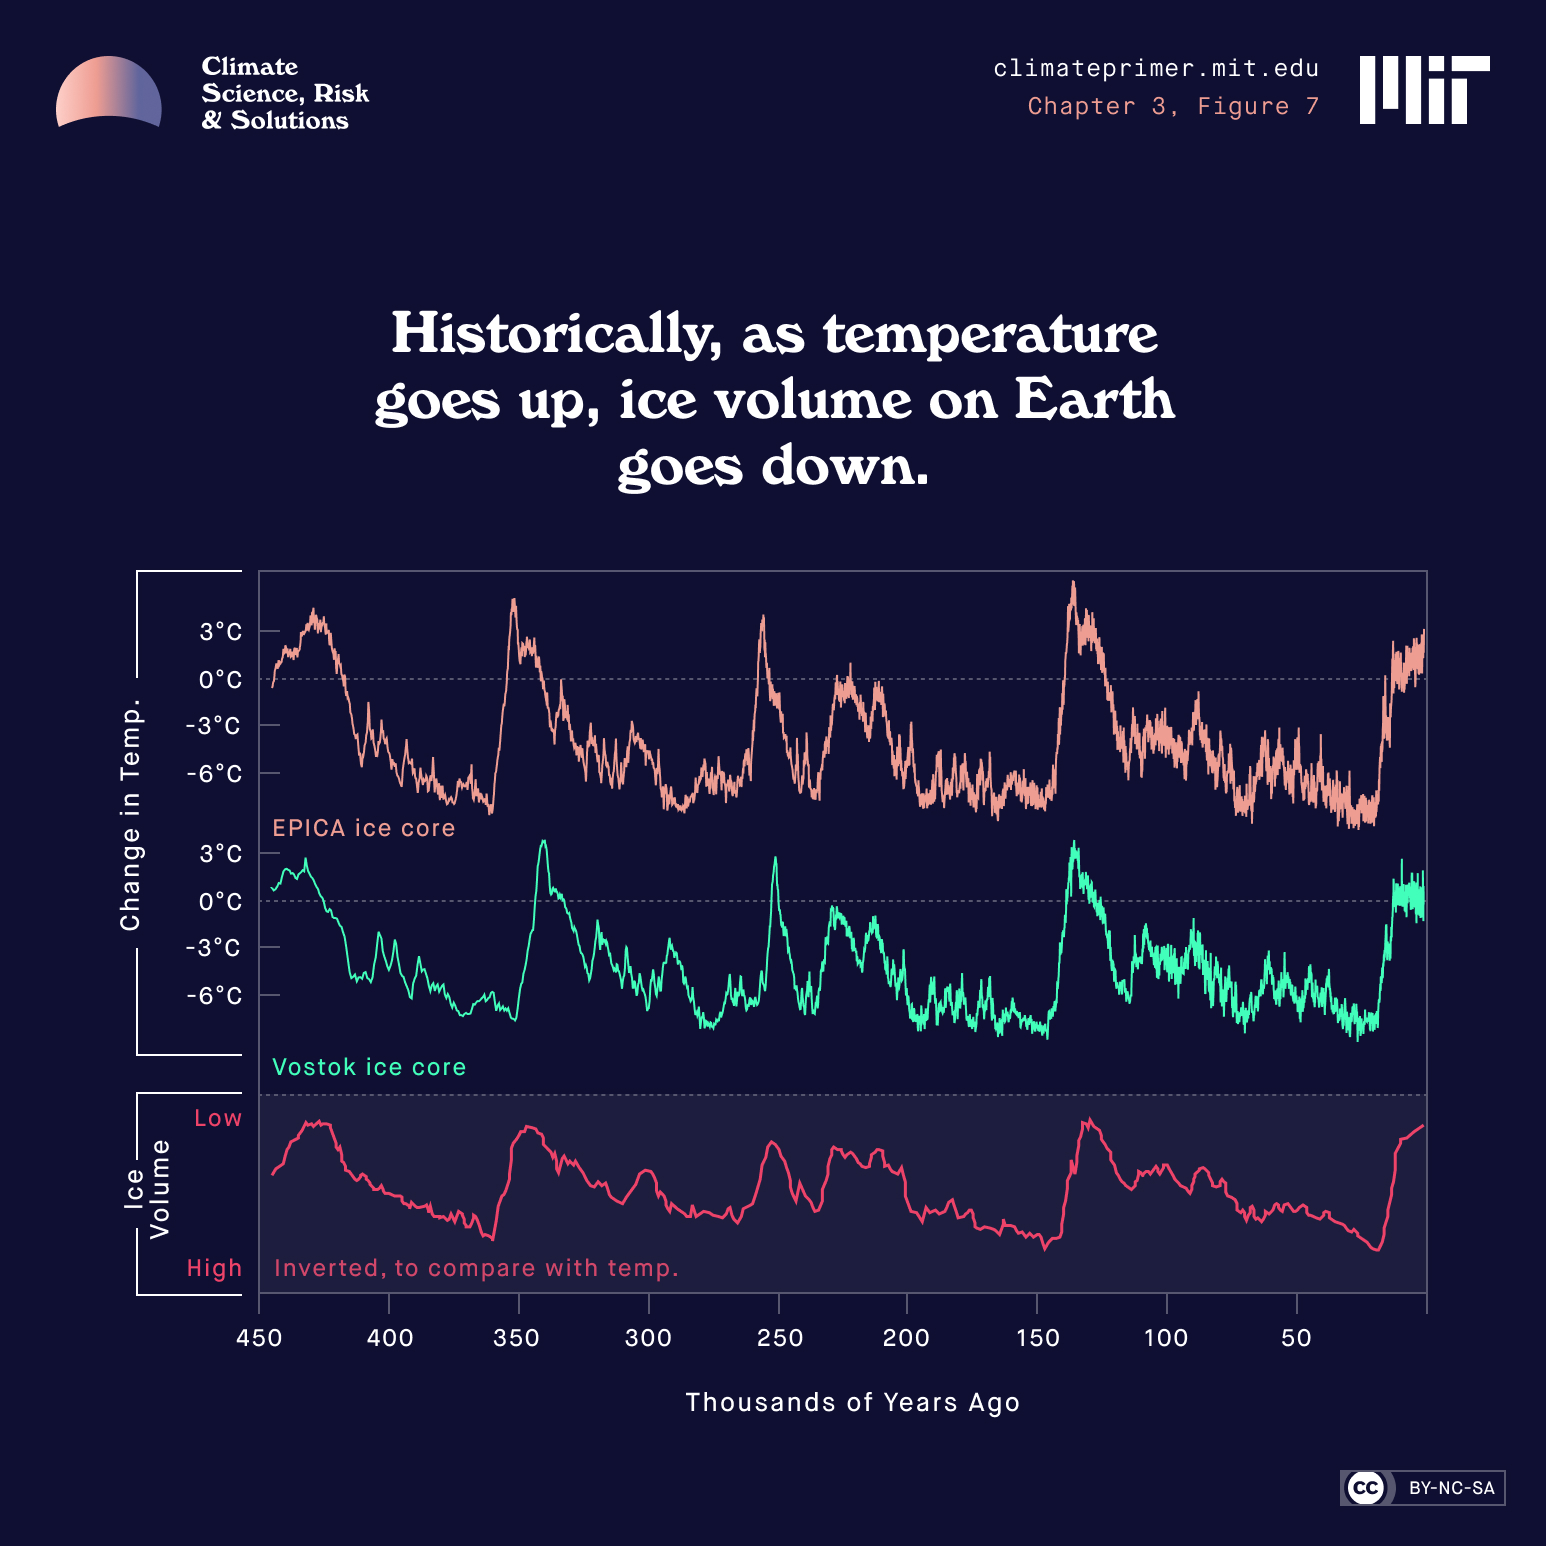
How do we know what the earth was like before humans existed? Tree rings, ice sheets, and sediments on the ocean floor reveal how our planet’s temperature and ice cover have changed over the course of hundreds of thousands of years. For example, scientists can determine prehistoric temperatures by drilling deep into the ice in places like Greenland and Antarctica and analyzing the makeup of ancient snow. Similarly, scientists have figured out that the shells of marine microorganisms carry indicators of how salty the ocean is. By looking at shells that have decomposed and settled on the ocean floor, they can estimate the volume of ice on the planet thousands of years ago.
Ice core samples can tell us the temperature of clouds that produced the snow originally.
On a 100,000-year time scale, temperature is cyclic.
These cycles are the great ice ages and interglacial periods, and we are in an interglacial period right now.