Chapter 04
The climate is always changing
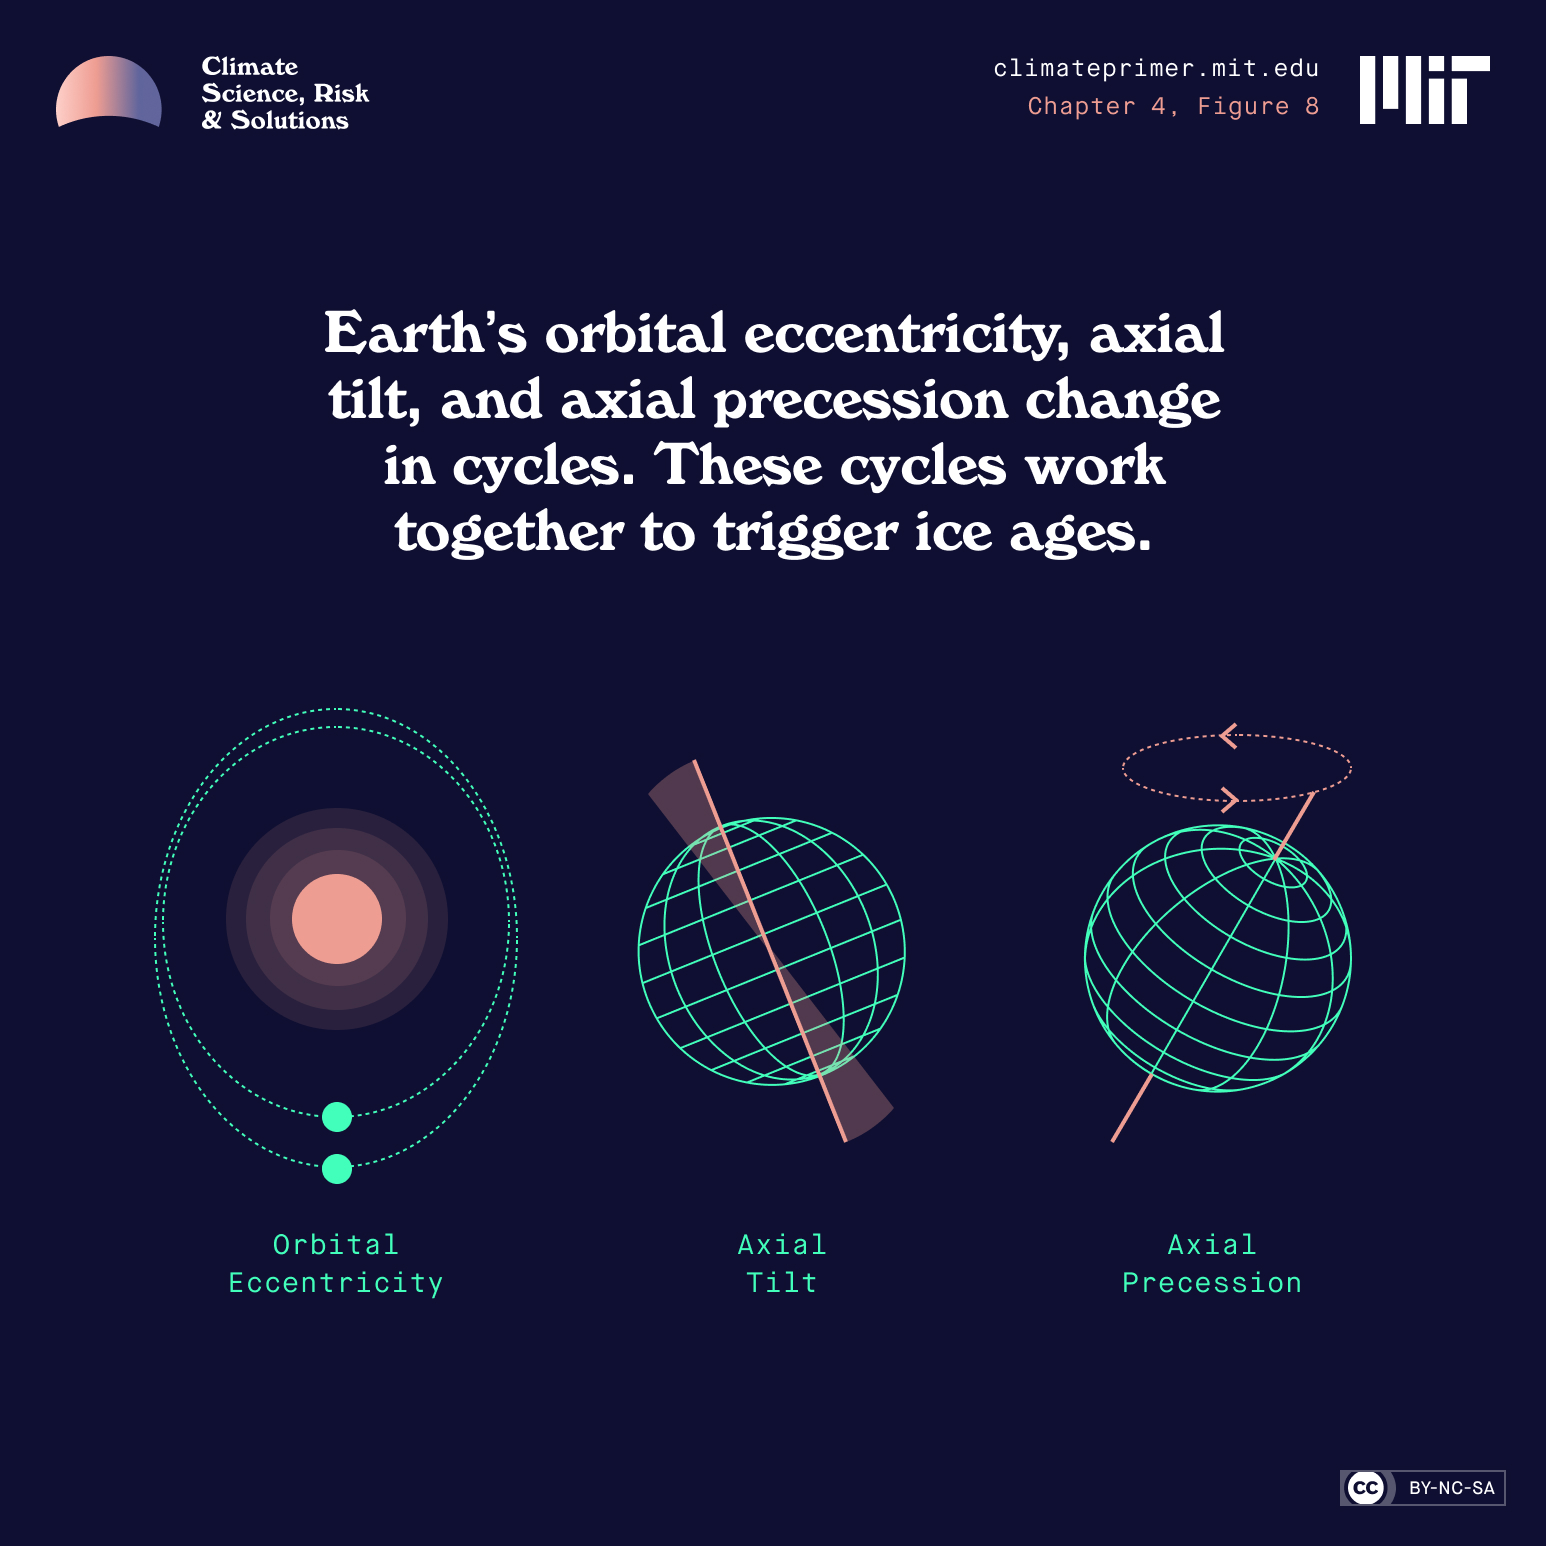
Earth’s orientation in space isn’t constant: our planet’s tilt, wobble, and the shape of its orbit around the sun cycles over the course of tens of thousands of years. These cycles are what cause the natural fluctuations between global ice ages and warmer periods. Our planet’s climate is also affected by volcanic activity and changes in how much energy from the sun hits the earth. One way that we know that the current warming is caused by human activity is because we are currently in a cycle that should be cooling the planet.

Ice ages are controlled by how much sunlight is received by the Arctic region during summer.
In the early twentieth century, mathematician Milutin Milanković calculated (by hand) how the distribution of sunlight varies and speculated that variations in arctic sunlight caused the ice ages.
The cause of these cyclic swings in temperature and the associated growth and retreat of great continental ice sheets was proposed by several scientists, notably by the Serbian mathematician Milutin Milanković in 1912. He recognized that the shape of Earth’s orbit around the sun varies cyclically over time—back and forth from more circular to more oval—with a period of about 100,000 years. Milanković also knew that Earth’s tilt with respect to the plane in which it orbits the sun wobbles over a cycle of 41,000 years, and that Earth’s rotation axis Precession is a change in the orientation of the rotational axis of a rotating body. Imagine a wobbling, spinning top.precesses like a top with periods of 19,000 and 23,000 years. These three factors—our planet’s tilt, wobble, and orbit—affect the way sunlight is distributed around the world, even though they hardly affect the total amount of sunlight received by the planet as a whole.
He speculated—correctly, it turns out—that ice ages are controlled by how much sunlight is received by the Arctic region during summer, and set about calculating this value from the basic laws of physics that control the earth’s orbit and rotation. After years of hand calculation, Milanković produced a curve showing how ice ages should behave. At that time, data such as those used to produce Figure 7 did not exist, and so there was only rough agreement with what little information there was. But today we know that the great ice ages were caused by the cycles computed by Milanković, though there are gaps in our understanding of the details of how Earth’s climate responded to these.
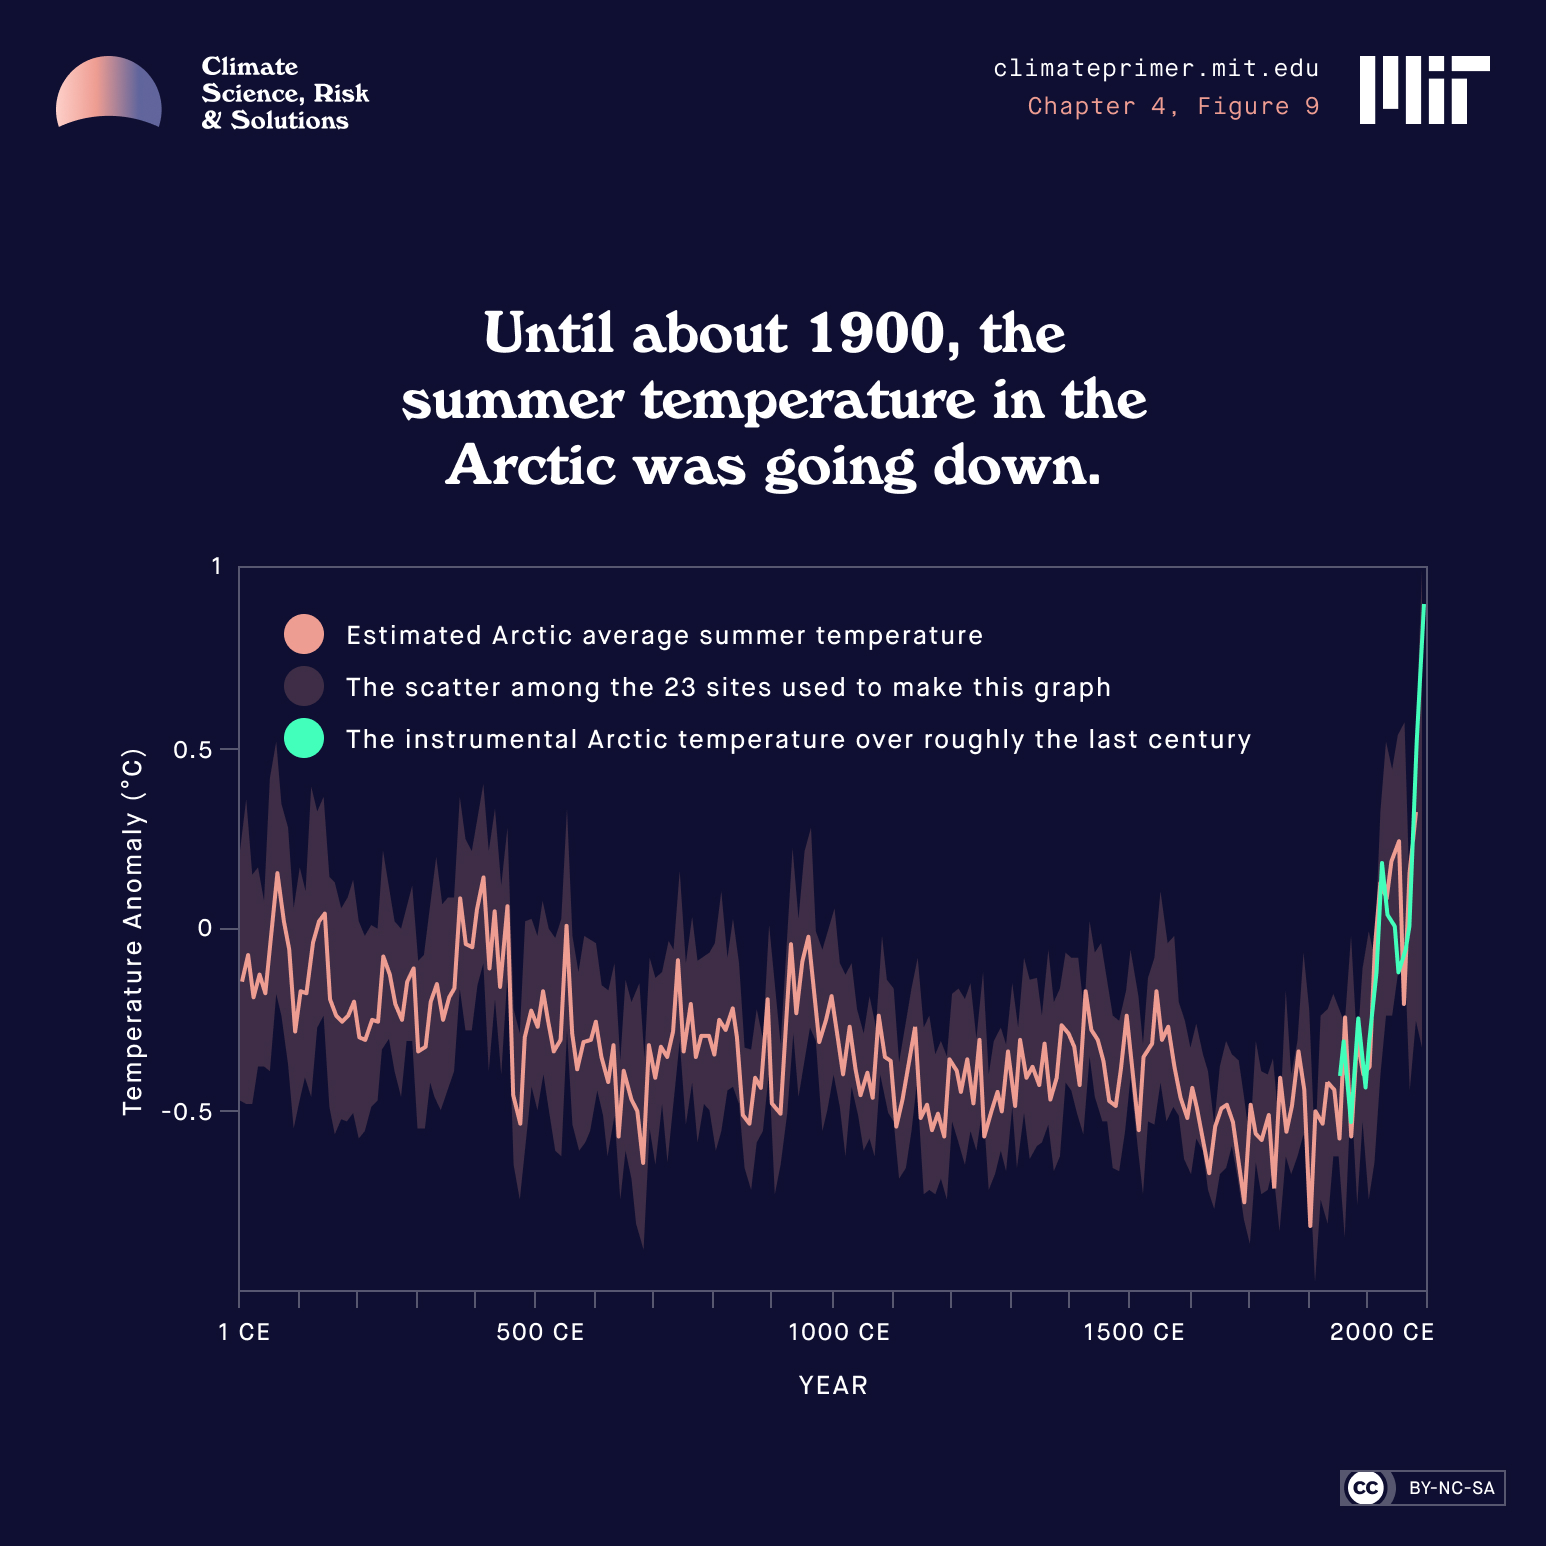
Until the industrial revolution, the Arctic had been cooling for many thousands of years.
Unimpeded, this mechanism would lead the earth toward another ice age.
This cooling is illustrated in Figure 9, which zooms in on the last 2,000 years of temperatures in the Arctic. The slow, steady cooling trend from the beginning of the record to around 1700–1800 CE probably reflects the slow decline in sunlight reaching the Arctic due to the Milanković orbital cycles. Unimpeded, this mechanism would lead the earth toward another ice age, with continental ice sheets beginning to grow thousands of years from now. But note the strong uptick in temperature toward the end of the record, particularly after about 1900. This is quite unusual by the standards of the last few thousand years and reflects the increase in carbon dioxide and other greenhouse gases brought about by humanity’s rapid consumption of fossil fuels. We are certain that this increase in CO2 concentration was caused by human activities because the isotopes of carbon in ice show that it comes from fossil fuel burning and the clearing of forests. Over the course of a few hundred years, humans rapidly burned fossil fuels that nature created over tens of millions of years.
Chapter 05
How much of the CO2 increase is natural?
So, the evidence suggests that the warming of the last one hundred years is unusual compared to the last few thousand years and is almost certainly caused by higher concentrations of CO2. But could the increased CO2 concentrations themselves be natural?
Learn More
Chapter 06
Predicting climate
06a What are climate models?
The real issue, of course, is what will happen in the future. Although ultimately we want to know what the human and monetary risks are, we need to start with something simpler: how global temperature will evolve going forward. But the Earth’s climate system is immensely, almost overwhelmingly complex. To deal with this complexity, scientists have created computer models to map these interactions and simulate how the Earth might respond under different scenarios and assumptions—and we’re getting an increasingly clear picture of what kind of temperature changes we can expect in the coming decades.
Our climate system is incredibly complex. Features like clouds, ice, and vegetation must be handled approximately and that, among other things, introduces uncertainty in our models.
06b Uncertainty
Scientists face tremendous challenges when attempting to model the Earth’s climate system. While there is a solid understanding of how many parts of the system work, our incomplete understanding of several aspects of the highly complex climate system introduces uncertainty into our attempts to forecast how climate will change.
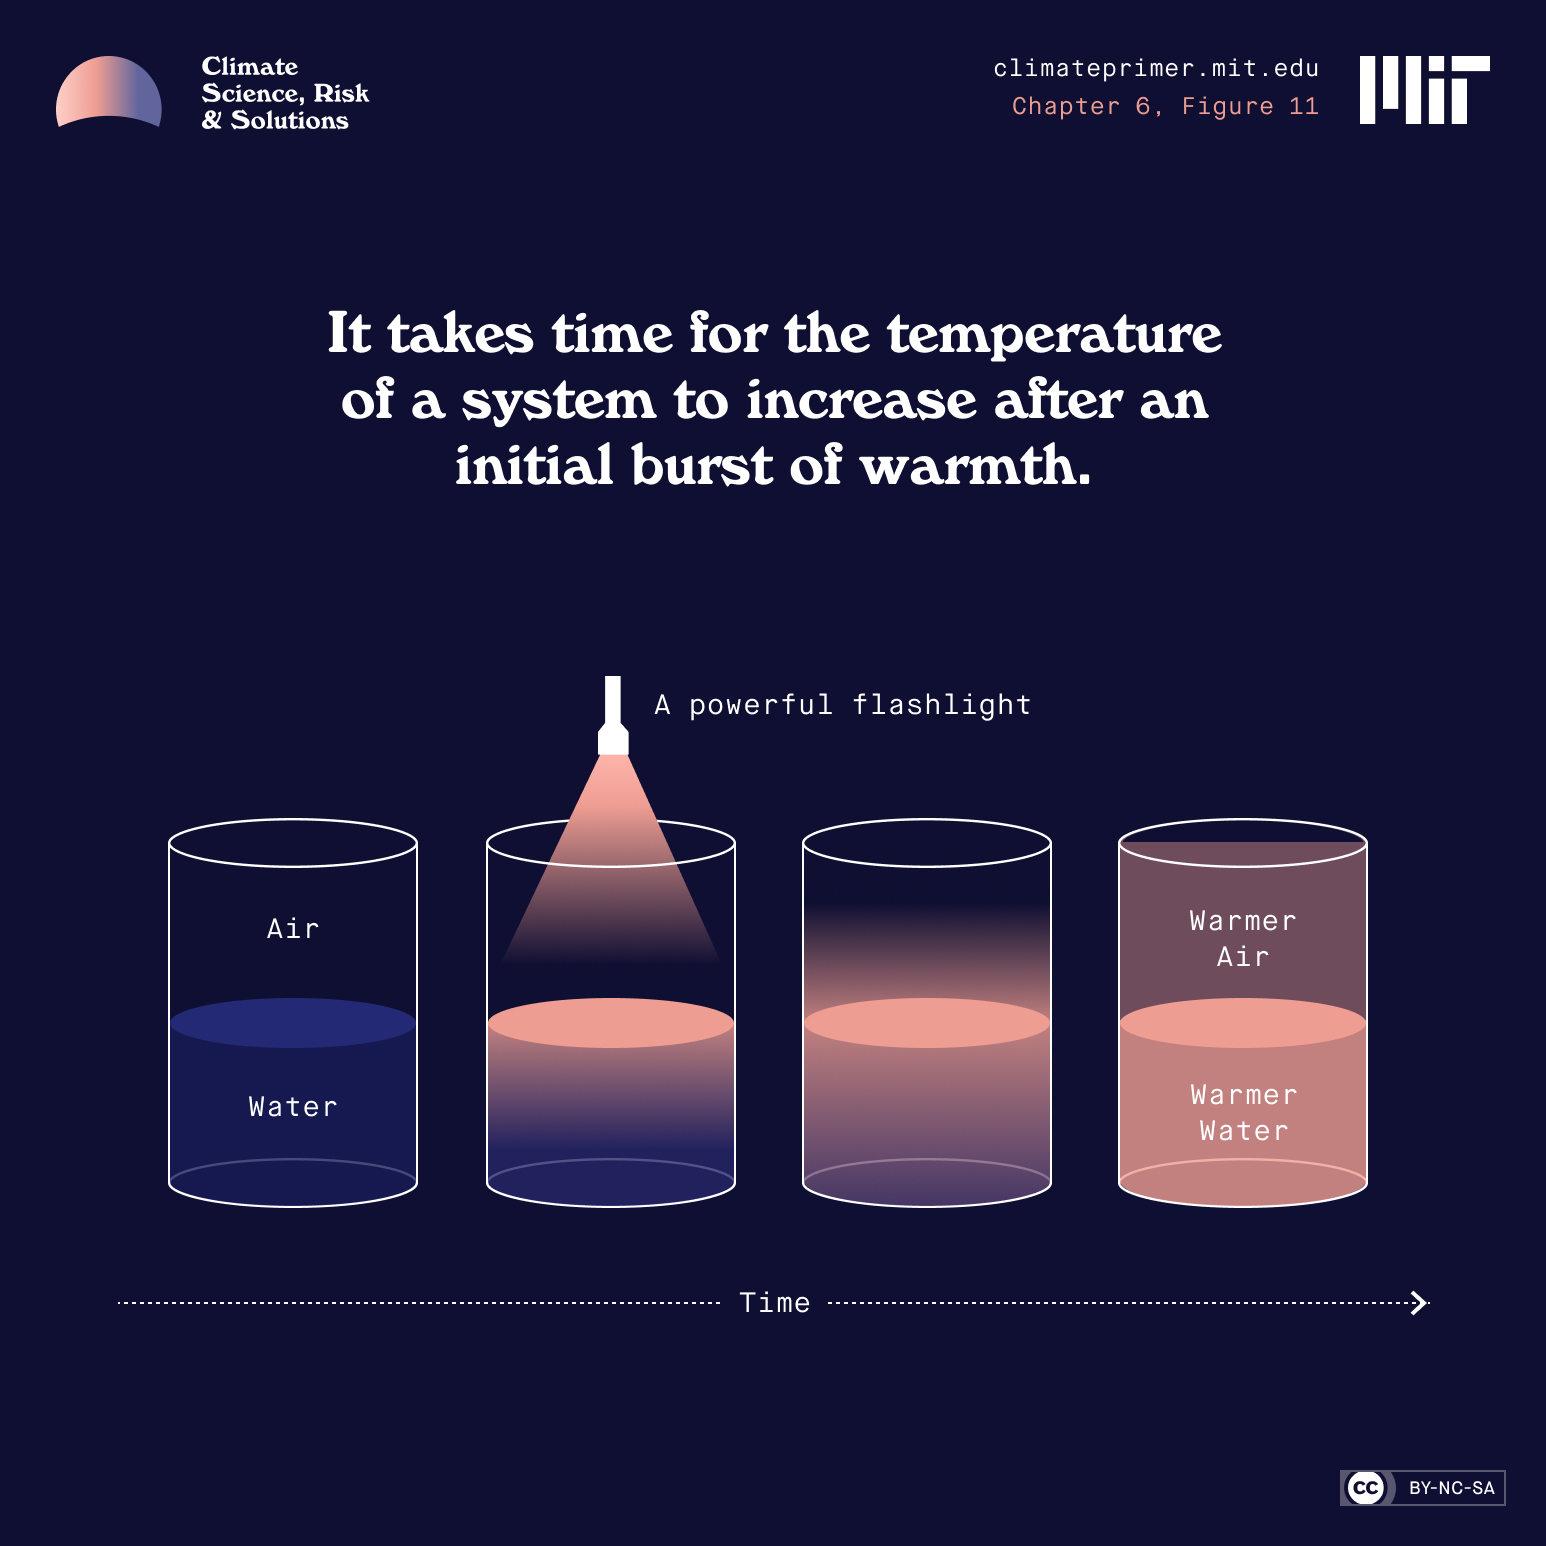
Another source of uncertainty is the response of the deep ocean to climate change. The oceans act as a buffer to temperature change and delay the response of global temperature to increasing greenhouse gases. Here is a good way to think about the effect of the oceans. Suppose we have a sealed glass cylinder containing equal volumes of air and water. If it is just sitting at rest with no energy going in or out through the walls of the container, the air and water will settle down to the same temperature. Add enough black dye to the water to make it opaque and shine a powerful flashlight down through the glass top of the cylinder. The light passes through the air but is absorbed at the very top of the water, heating it. So the top of the water warms up, and since that is the part that is in contact with the air, the air warms up too. But the water below the surface is not heated by the light, which never makes it down below the surface, so it remains at the temperature it had before. But slowly—very slowly—the warmth of the surface water is diffused down into the deep water and this both warms the deep water and cools the surface water and with it, the air.
Thus after we turn on the flashlight there will be an initial fast warming of the air and surface water, followed by a very slow increase in the temperature of the whole system. Eventually, the water and air will reach a new, warmer temperature. How long it takes to do so will depend on how rapidly heat diffuses downward into the deep water.
Our models could account for the lag between heat input and temperature change in the real world if we had a simple theory for how heat penetrates the ocean depths. We know that heat is mixed rapidly downward to a depth of between 20 and 150 meters (60 and 500 feet), depending on location and time of year. If heat did not penetrate deeper, then the 20–150 meter penetration would give a lag of around two years. But we know from measurements that heat manages to circulate much deeper in the ocean, taking quite a long time to do so, perhaps as much as 1,000 years. Just how this happens is complex, and is a source of uncertainty for longer range climate projections.
Finally, mathematical models of climate-like systems can exhibit sudden, unpredictable shifts. We don’t know for sure whether our climate is an example of such a system, but there is evidence encoded in ice cores from Greenland that ice age climates can jump rather quickly from one state to another. This evidence, together with our models, puts mathematical teeth on the idea of tipping points—sudden and largely unpredictable shifts in the climate state. This idea keeps many a climate scientist awake at night.
06c Dealing with uncertainty
As the Danish physicist Niels Bohr once remarked, “Prediction is very difficult, especially about the future.” Scientists have developed a number of different strategies to account for uncertainty, and have used these to estimate the range of possible temperatures that we will see in the coming century. There are roughly 40 climate models run by different organizations around the world, and they all give somewhat different predictions about the response of climate to increasing concentrations of greenhouse gases. In addition, we have to estimate just how the greenhouse gas content of the atmosphere will evolve over the coming centuries, which requires not just an understanding of the physics, chemistry, and biology controlling these gases but an assessment of human behavior—how much greenhouse gas will we end up emitting?
06d What the models say
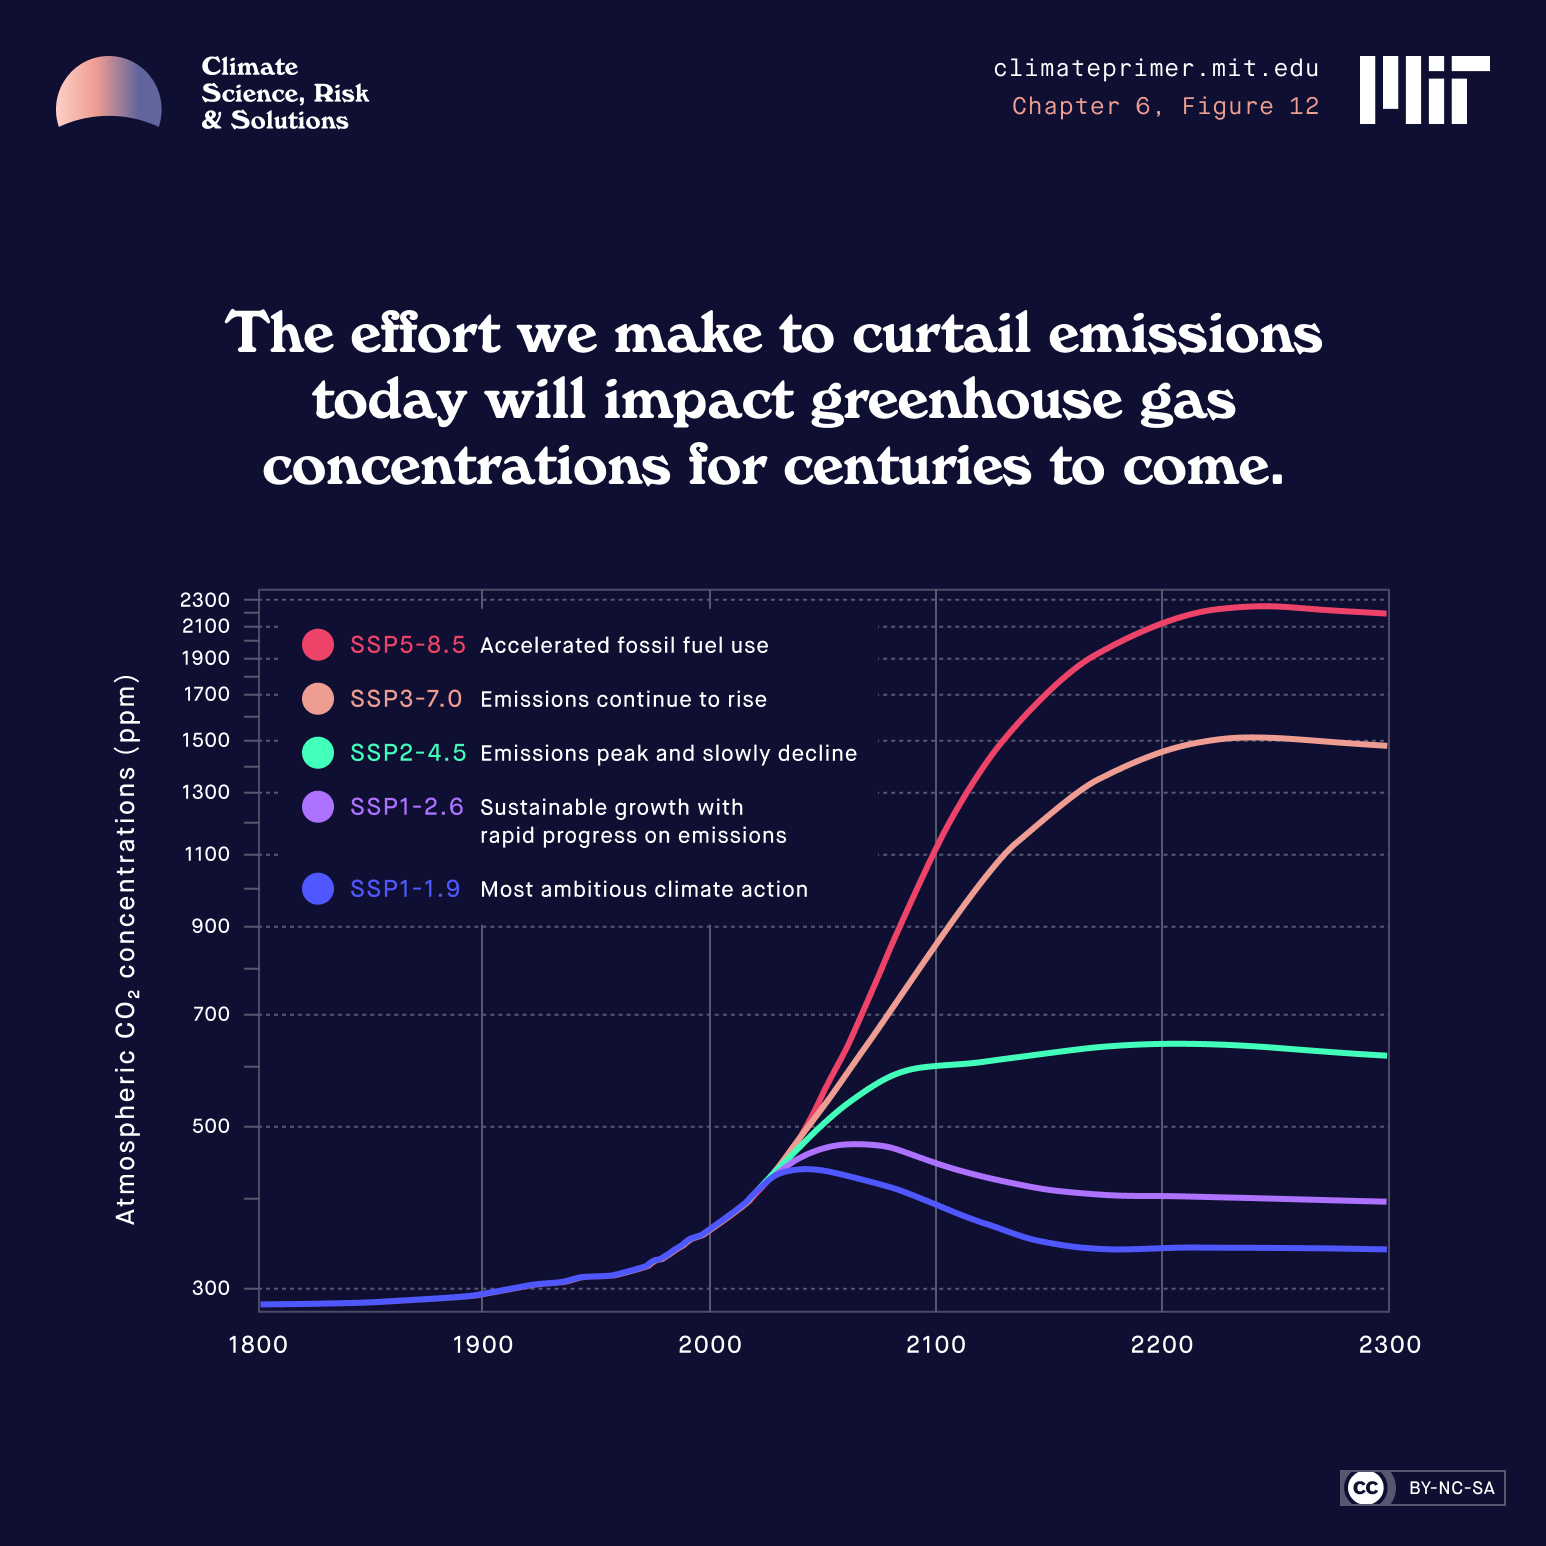
Thanks to current efforts to develop and deploy clean technology, and to implement policies that reduce carbon pollution, these models show that the odds of surpassing a global temperature rise of 4ºC are much lower than they were in the last IPCC report. Even so, if countries fail to meet their climate commitments–or if natural carbon cycle feedbacks are more positive than predicted–by 2100, global mean temperature may rise between 3.3°C and 5.7°C (that’s 5.9°F to 10.2°F), and by 2300, by between 6.6°C and 14.1°C (that’s 11.9°F and 25.4°F).
The red curve in Figure 12, SSP5-8.5, implies a doubling of CO2 emissions from current levels by 2080, representing the very high warming end of future emissions pathways. This is the predicted result if high economic growth continues with a strong reliance on fossil fuels. While the plausibility of the SSP5-8.5 scenario has been debated in light of recent decarbonization efforts, due to uncertainty in carbon cycle feedback loops, it is still considered necessary to understand the potential impact of this high emissions, high warming scenario.
The other four The IPCC developed five ‘Shared Socio-economic Pathways’ (SSPs) that show low, medium, and high warming scenarios depending on different levels of GHG emissions.SSPs assume higher levels of mitigation of greenhouse gas emissions and are useful for estimating how various mitigation strategies might ameliorate climate change.
In the most dire scenarios, humanity’s carbon emissions could deliver us CO2 concentrations not seen for 50 million years.
This was when alligators roamed Greenland and sea levels were 230 feet higher than today.
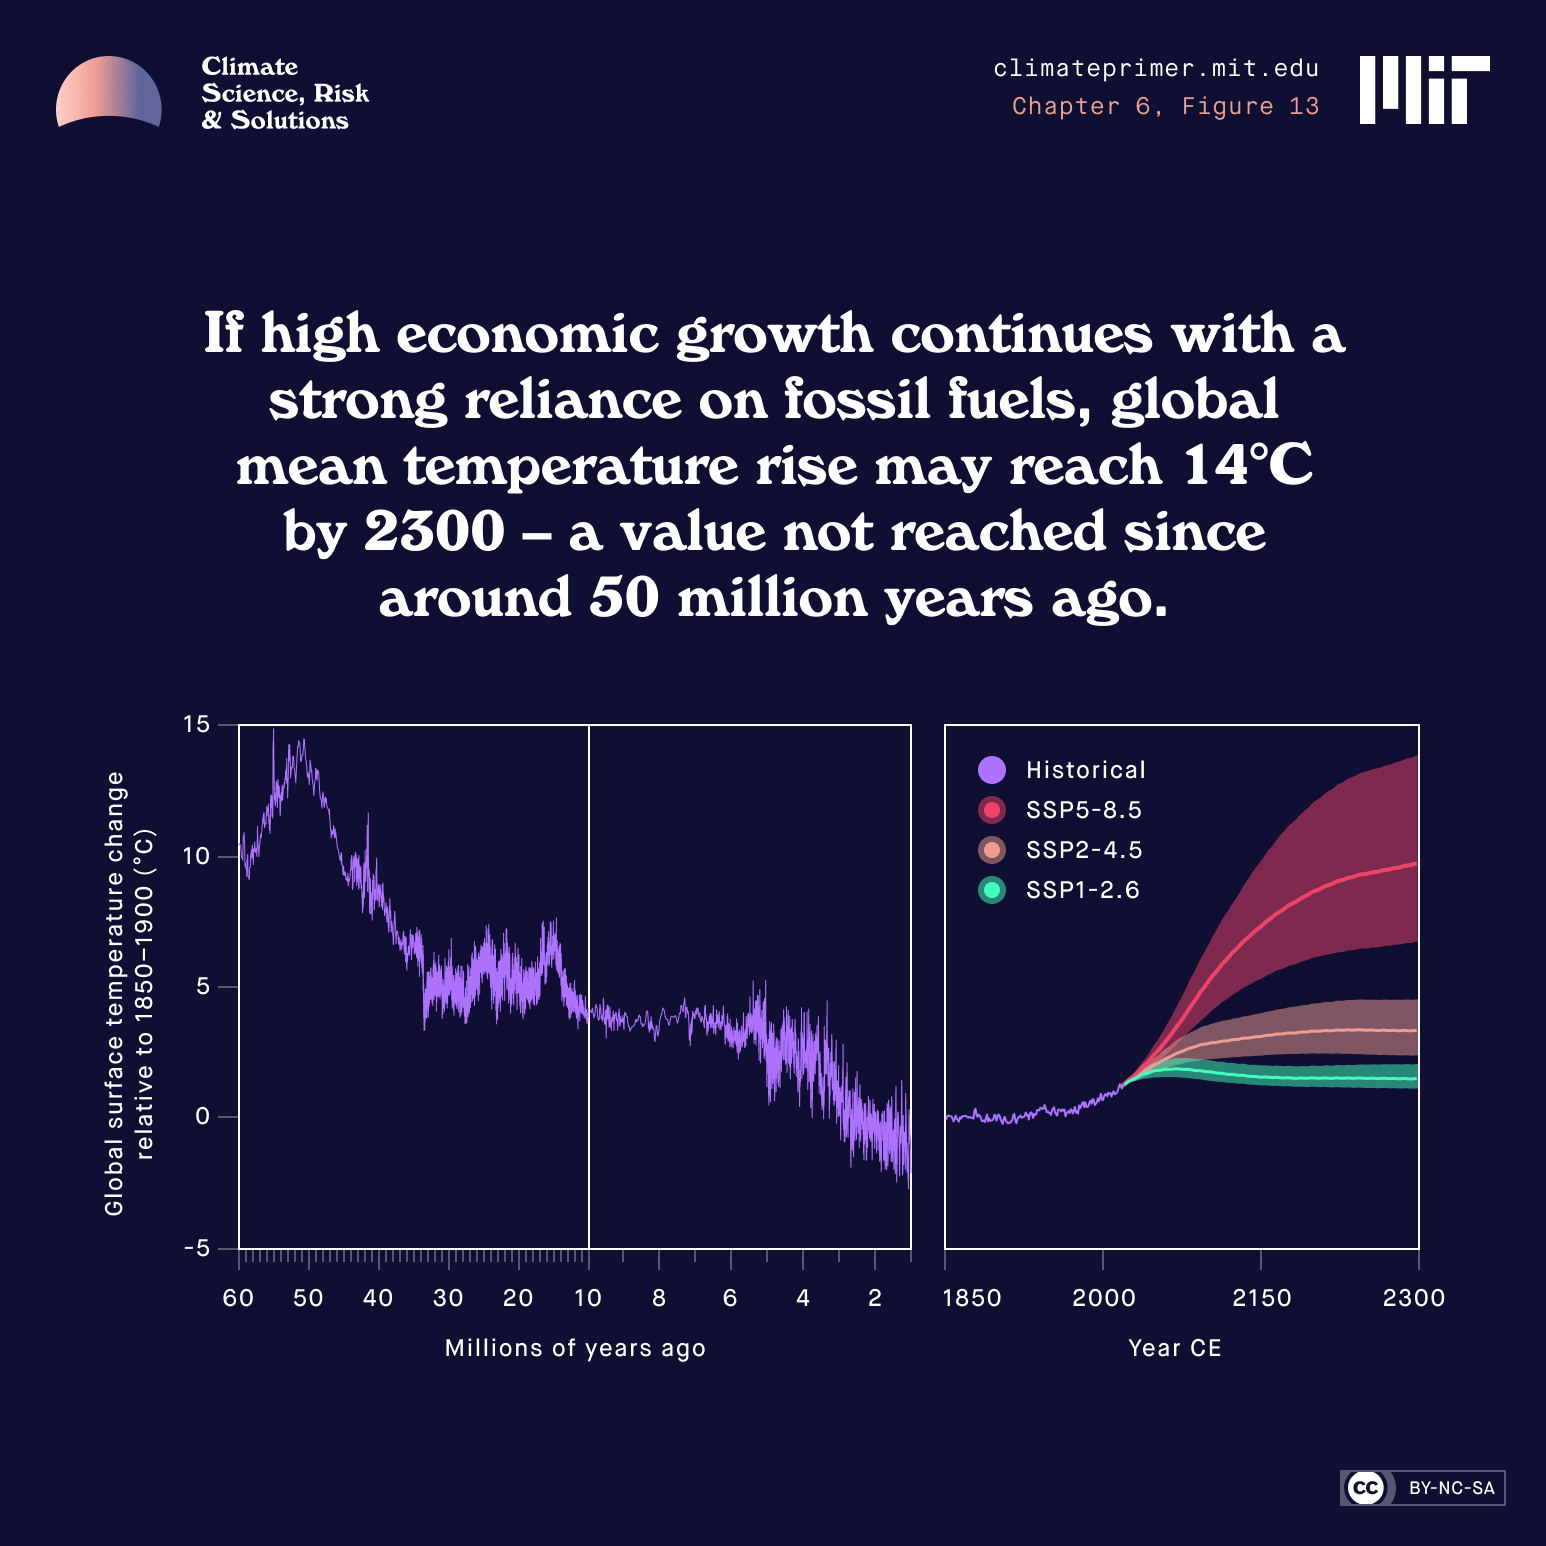
In its Sixth Assessment Report, the IPCC projects that in the high emissions scenario SSP5-8.5, if high economic growth continues with a strong reliance on fossil fuels – or if natural carbon cycle feedbacks are more positive than predicted – then by 2100, global mean temperatures may rise by between 3.3°C and 5.7°C (that’s 5.9°F to 10.2°F), and by 2300, by between 6.6°C and 14.1°C (that’s 11.9°F and 25.4°F).
As Figure 13 shows, paleoclimate proxies suggest that such a value has not been seen since at least the Eocene period, roughly 50 million years ago, when alligators roamed Greenland, and sea level was 70 meters (about 230 feet) higher than today’s.
But what are the consequences of these changes? How will they affect us in human and economic terms? We next consider the set of real risks that climate change poses and how, at least for some risks, we might go about attaching actual numbers.